The command allows you to see which process(s) use most of your resources such as CPU and virtual memory. You will also be able to identify the number of tasks and whether these are running, sleeping or have stopped.
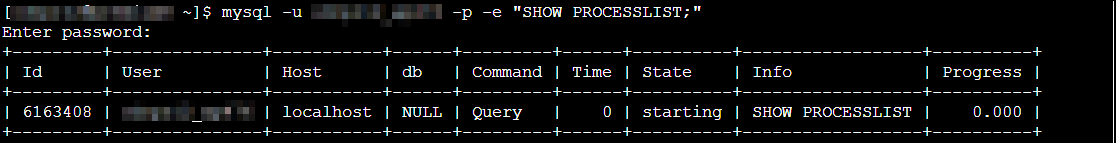
If the process is generated by a script, the simplest way to disable use of this script is to rename it. Or you can create the
Deny from all record in the .htaccess file where the problem script resides.
You can find more details
here.
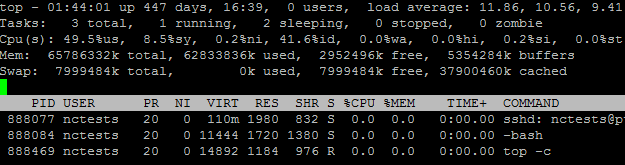
The
first line shows the current time, time since last boot, logged in user session and average system load (over the last minute, 5 and 15 minutes).
The
second line indicates the total processes, running, sleeping, stopped, and zombie (that have been terminated but have not been properly removed).
The
third line shows how the CPU is used in %:
| us | user processes |
| sy | system processes |
| ni | priority upgrade nice |
| wa | time waiting for I/O completion |
| hi | hardware interrupts |
| si | software interrupts |
| st | time stolen from the virtual machine by the hypervisor task |
The
fourth and the
fifth lines show memory usage (RAM): total, used, free and buffers. The first row shows physical memory and the second one shows virtual memory (swap) of the server.
The
next rows provide details on the current processes:
| PID | ID of the process |
| USER | the user that is the owner of the process |
| PR | priority of the process |
| NI | nice value of the process |
| VIRT | virtual memory used by the process |
| RES | physical memory used by the process |
| SHR | shared memory used by the process |
| S | status of the process (S - sleeping, D - uninterruptible sleep, R - running, T - stopped, Z - zombie) |
| %CPU | percentage of CPU used by this process |
| %MEM | percentage of physical memory used by this process |
| TIME+ | total cpu time used by the process |
| COMMAND | name of the process |