
How to measure what’s moving your business forward
An entirely digital business means you can measure and record everything. Gone are the analog days of struggling to understand exactly how many people came in, what they bought, how they paid, and what discount codes they used. Today, businesses can automatically record almost everything that occurs, and see that data presented in all manner of flashy tables and graphs at the touch of a button.
Theoretically, at least, this should mean things are much easier. But there’s such a thing as overwhelm, especially when you don’t know exactly what you’re looking at, much less how to extract value from it.
Someone must have come up with an approach that allows the uninitiated to process the abundance of information they’re presented with, and use it to solve real-world business objectives. Well, someone has… And you’ve come to the right place.
So let’s tentatively dip our toe into the world of analytics, not by wading into the vast swathes of data you’ve collected, but by asking much broader questions about what you want to achieve, and working forward from there.
The framework
To do this, we’re going to divide our process into a framework of three steps:
- Goal — something your business wants to do better.
- Signal — using evidence to understand how to progress towards your goal.
- Decision — what you choose to do based on what the evidence tells you.
Selecting your goals
So firstly, let’s establish what a goal looks like. Think really top-level. In fact, if you’re struggling, start as broad as you can, and then whittle it down from there. For example, ask yourself why you’re in business. If the answer is “to make money”, then good goals might look like:
- Get more people who land on your site to purchase/convert.
- Get more inquiries or sales.
- Encourage retention/repeat customers.
These are maybe the most universal business goals of all, so it’s these that we’re going to run through our Goal → Signal → Decision framework.
But even if these goals aren’t right for you, the strategy itself works for any other goals. If you aren’t in the retail space, you might want to use things like:
- Expand website reach — a fairly universal goal that has more relevance to content creators.
- Create more brand awareness — important for businesses introducing a brand-new product that requires them to help an audience understand what pain point their product solves.
- Create a stronger local presence — for example, if you’re a brick-and-mortar business where local knowledge is key.
Whatever your goals, there will be signals you can use to gain insights that inform your next steps. And if you aren’t collecting them already, you can start for free.
All of the metrics we’re using for our signals can be tracked easily, and usually for free. This includes data from analytics software (like Google Analytics and Jetpack), as well as data you should already have from your social channels and sales records.

Finding signals for Goal 1: “Get more people who land on your site to purchase/convert”.
This is an incredibly tantalizing goal, because you’ve already done the hard part (getting people to land on your site). Now you just need to find a way to extract the most from them.
What we want to use our signals for is to determine what people are doing on the website, and whether we can solve any pain points.
Top tip: The signals we’re about to examine are by no means the only data that can help with this goal. But they’re one cohesive, pragmatic way you can narrow almost infinite signals down to give you a better picture of your site.
Signals needed: Total visitors, bounce rate, time on site, Path Exploration data (sometimes called flow), and website testing.
Signal 1
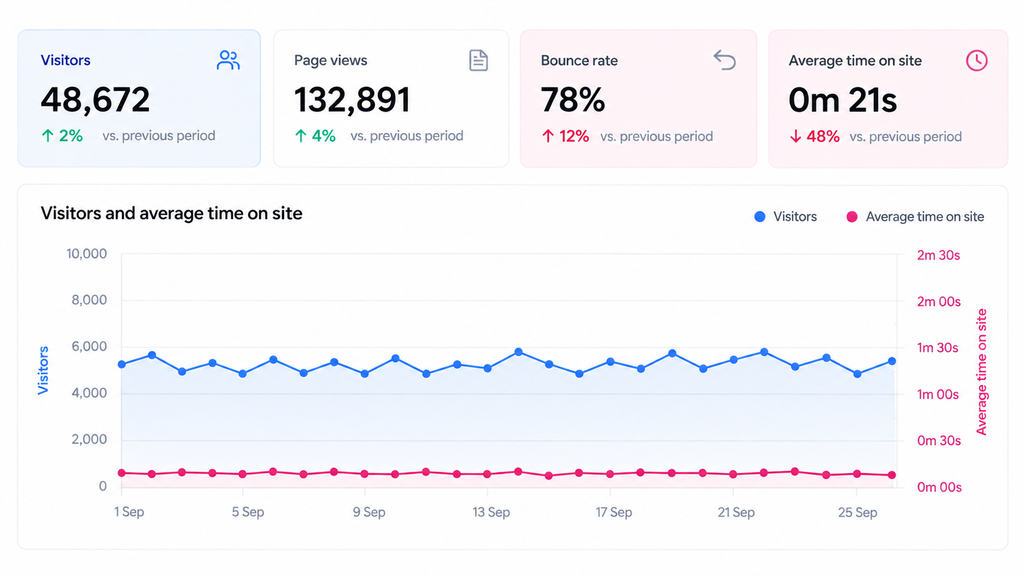
To help illustrate the example, I’m going to feature data from my (imaginary) online camping supplies store. This graph is showing fairly standard Analytics data. The kind of thing you’ll see simply by navigating to your property on GA4. It shows my store’s performance throughout September.
We can see total visitors, the total page views that resulted from those visitors, the bounce rate (which Google defines as a session that lasts under ten seconds, has no key event, and fewer than two page views), and the average time they spent on my site at the top, followed by a graph breaking this down by day.
It’s one of the more standard presentations you’ll find in analytics programs, but it’s a potentially misleading one if you don’t know how to interpret it.
For example, if we look only at the number of visitors, it looks like a healthy number for my site. Most days, around 6,000 people are landing, and that’s not to be sniffed at.
But when we connect this metric to the bounce rate and time spent on site, we can see there’s a significant problem. Or perhaps more accurately, a massive opportunity: most people who engage are staying for just over 20 seconds on average.
Signal 2
It’s important to try and get some context for this alarming metric. To do so, I’m going to go to Path Exploration in Google Analytics. In other software, it might be called “Purchase flow” or similar. Whatever the name, it should look something like this.
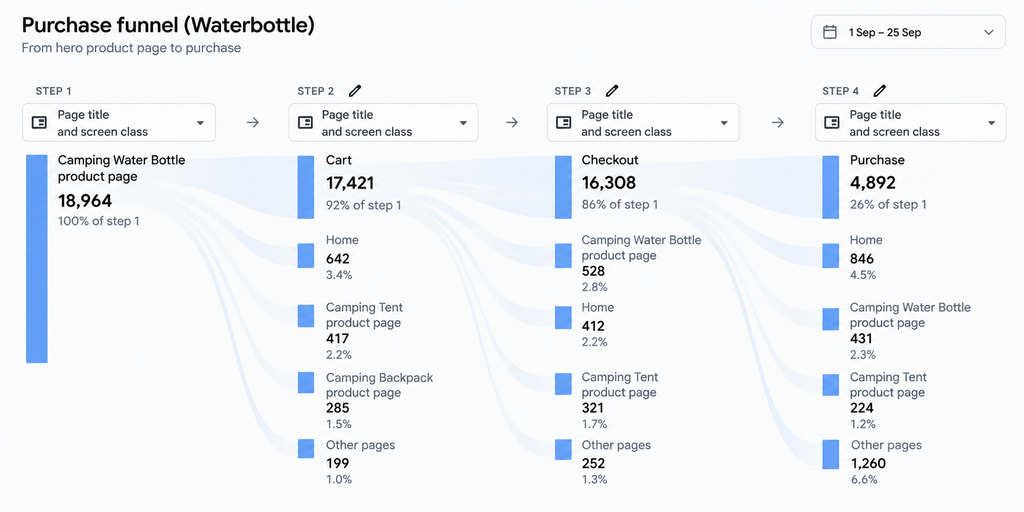
This tells me a step-based timeline of a visitor’s journey by page. The most common journeys are aggregated and rise to the top.
To help this be as meaningful as possible, I’ve chosen to start the flow on the page of my most popular product, which I know is one of my most popular landing pages.
Immediately, I spot something that might shed light on why (or more to the point where) people are dropping off.
I can see the vast majority of the people who land on my star product add it to the cart. And most of those proceed to check out.
But a very low percentage of those who make it to the checkout actually buy the product. This is significant.
Signal 3
Based on the above, I want to rigorously test my checkout process to ensure there are no errors, ambiguous instructions, or other reasons someone might drop off. I am going to use all the main browsers, both from an account and as a guest, and in mobile and desktop mode.
It’s surprising how often these differences can change things. It might be as simple as a button not appearing in mobile mode, for example. In my case, I’ve found the checkout is working fine, which rules out a technical reason.
Between these three signals, I’ve established that people are dropping out at the checkout, and eliminated one potential issue (by testing the checkout itself). But while these signals have illustrated a problem, they haven’t given me its exact cause.
It’s important to note that signals alone are not meant to be completely diagnostic, so you shouldn’t feel disheartened if you’ve found an issue but not a solution at this point. We’re only on the Signal step. Now, we can make some decisions about what to do next.
Decisions
There are several avenues I want to explore based on what came to light in the Signals section.
My site only has one payment option at the moment: credit card. This absence of variety might be putting off some people who prefer instant methods (like PayPal), or it could even be that they don’t trust my site with their card details. It sounds like an overhang from another era, but paying by card can still feel riskier to customers, especially on a site they don’t know.
I can add other methods easily using a provider like Stripe, and this may help more customers proceed.
The next thing I’m going to explore is whether there’s something more fundamental putting my buyers off on the checkout page itself, and maybe even check other places on the site where buying mechanics are mentioned. Is everything up-to-date and matching in every location it’s described? Is there some wording that seems ambiguous and potentially off-putting?
A good place to focus my energy is shipping: is it fast enough, cheap enough, and reliable enough? As my hero item is a water bottle, there might be a fairly low maximum on what people are willing to pay for shipping. My shipping is $8.99 by expedited courier. I did this because I wanted the customer delivery experience to be top tier, but is the high price putting these potentially interested buyers off?
Adding a lower rate with inferior delivery times gives customers the feeling of choice. They can elect to pay less and get a slower service. Simply adding a secondary option will answer the question of whether this was the issue.
If there are no viable shipping options for less, I could consider whether there are upsells (better products), bundles, or cross-sells (complementary products) I can offer that might bring the relative shipping cost down per item.
Adjust your decisions based on your data
It’s worth remembering that the same metrics I used above could lead to very different decisions if they were different. What I mean is, don’t get caught up in my decisions. It’s important to use your data.
For example, if my first chart looked more like this, where the visitors were exploding, but the average time on site had progressively decreased over the course of September, my investigation and decisions would look very different.
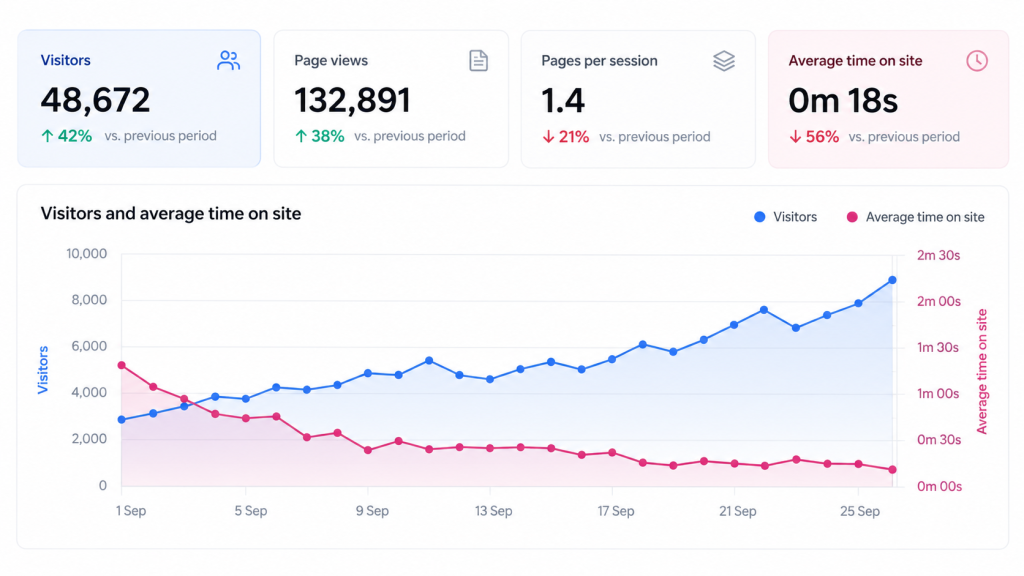
Firstly, I’d be asking where the traffic came from, and break down the stats by geography. It stands to reason that if I’ve suddenly become popular in a country I don’t sell in, engagement would drop.
The point is, our examples are designed to demonstrate the framework. The conclusions will be your own. Follow the data, wherever it takes you.

Finding signals for Goal 2: “Get more inquiries/sales”
Once you’re confident your site is rinsing the most sales it can out of its visitors, your goal is likely to shift to getting more. There are many ways to approach this, but I’m going to examine two key approaches and how signals might help your process.
Signals needed: Top landing pages, Path Exploration, sales data by item, keyword tools, and qualitative observations.
Signal 1
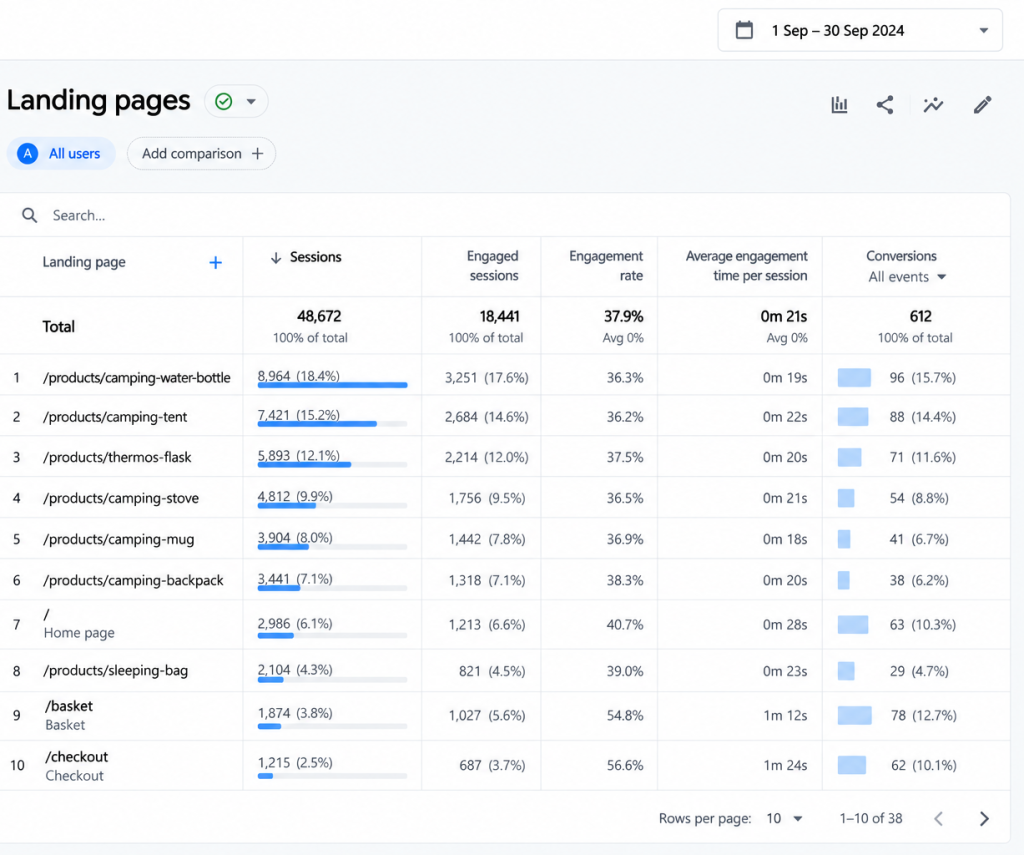
This breakdown of what landing pages my visitors hit isn’t necessarily all it seems at first glance. We might presume the camping tent is my second-best seller after the water bottle. But I happen to know I’ve never packed up an order with a camping tent in it. So what’s going on, and what does it tell me?
In the most basic sense, this metric is telling me which products are drawing the most traffic. This raises a few questions: Similar to our first example, I might ask what’s wrong with the tent product? Is there something preventing a purchase?
So, as before, my first port of call might be to again examine the journey the people who landed on this page took through my site.
Signal 2
I can do this by checking Path Exploration on Google Analytics, and this time, selecting the camping tent as my starting point.
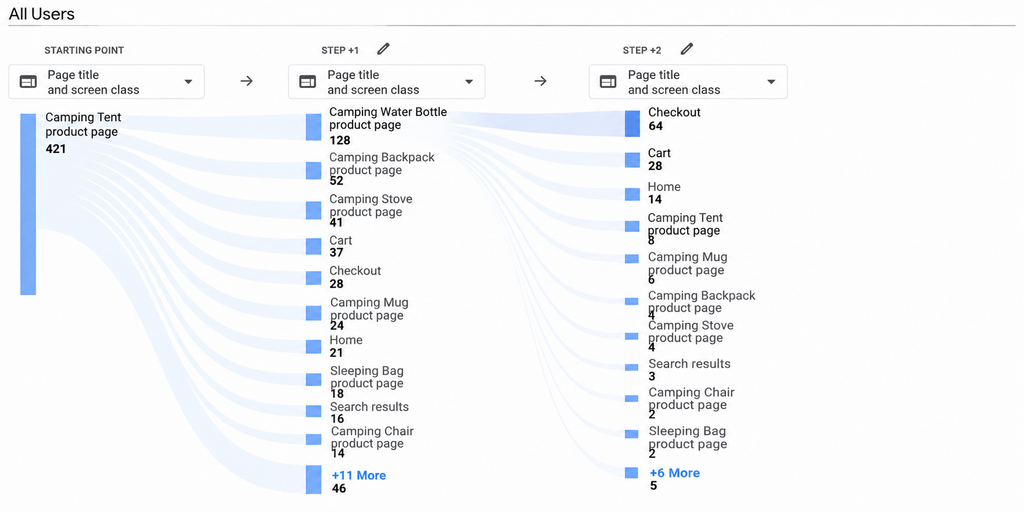
Here, I can see that a large proportion of the people who land on the tent click through to my hero water bottle page. By clicking that, I can further see that a lot of people who make it to my water bottle are then checking out. So, while the camping tent traffic looks worthless when I consider I haven’t sold any tents, digging a little deeper has helped me understand it’s not.
A useful aside, but let’s look at what actually sold. To do this, we’re going to use on-site stats. Jetpack is a great tool to measure these if your site is built on WordPress, but there are others (like Matomo) that can plug into custom-built sites.
Signal 3
The presentation of your sales stats might look different to mine depending on the analytics software you’re using, but most tend to be fairly consistent with what they record: units sold, price, customers, etc.
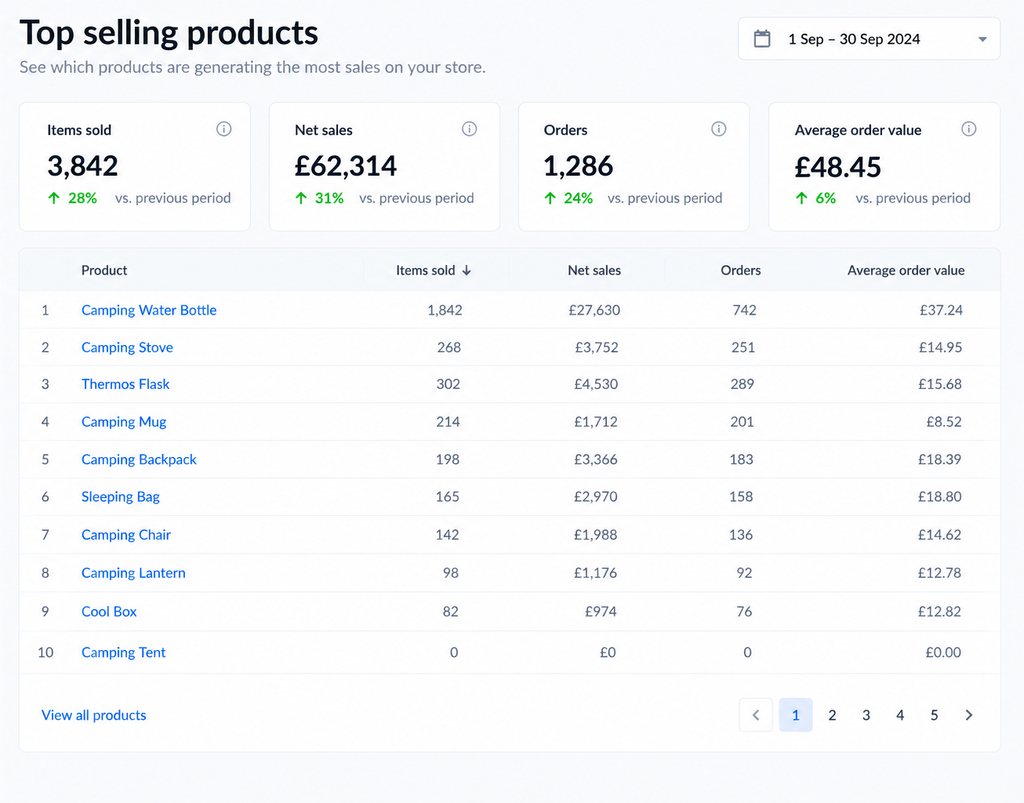
Analytics data is accurate, but because it measures on-site behavior, it’s open to interpretation. This data is more straightforward: it tells me exactly what sold, which makes it easier to act on.
Primarily, we’re going to use this data to see, at a glance, what is selling best, and how it compares to other items in terms of revenue. You might be surprised to see certain products have sold more than you realized, and vice versa.
Signal 4
Keyword tools can be really helpful. These essentially tell you what people are typing into search engines, and rank where there are potential gaps in the market. That is, areas that are potentially underserved by your competitors and could be ripe for expansion.
By setting up Google Search Console, you can see these kinds of metrics. Similarly, RelateSEO takes this one step further by turning keyword research data into a set of actionable tasks.
Signal 5
Finally, I want to take into account my own qualitative observations from sitting at the controls of the business.
Do the camping stoves keep getting flagged by couriers (because they contain flammable chemicals), incurring a fine?
Is the cool box uneconomical to sell because its size means it costs too much to ship?
Do the lanterns have a high return rate because the bulbs keep blowing after a week?
All these signals are going to alter how I execute my expansion.
Decisions
The data we’ve just examined, combined with what I know, seems to show a strong business that has a lot of customers arriving, and it is clearly converting many of them into buyers.
Noticing the function the camping tent is providing for my business (drawing people in, but converting them to other products rather than selling itself), I might consider optimizing its landing page so that it better guides customers to my products with higher conversion rates.
My Path Exploration data reveals they’re finding the water bottle already, likely due to it being a suggested item. Adding more suggested items to the tent (an additional link to the thermos is an obvious choice) might help.
Combining the product sales data with findings from keyword searches will give me a strong idea of what products should be added, and whether they are likely to rank organically if I add them. Adding more products can help a site’s SEO over and above whether one individual product ranks. A larger catalog gives search engines a clearer idea of what a website does, and even when a product goes out of stock, its page might continue to draw people to the site.

Finding signals for Goal 3: “Encourage retention/repeat customers”
A vital part of growth is not only getting new customers, but keeping your old ones. This is fundamentally how you grow without burning through startup levels of marketing budget. This is where I’ll leave my imaginary camping store behind. Retention comes down to your own customers: who they are, how they buy, and what they say about you. That’s something no made-up example can show you.
And there are data signals you can use to help you build a site that’s optimized to retain your own loyal customers.
Signals needed: Purchase data, customer accounts, subscriber consent, social channels, and qualitative observations.
Signal 1
Rather than using the analytics from Jetpack (or a similar tool), we’re simply going to go to your general orders page. Here, you can use ordering and filtering tools to get valuable information about your customers’ buying habits.
A good starting point is sorting by the number of orders each customer has placed (high to low) to immediately see your most valuable and loyal customers. Reversing this order will also show you customers who only placed one order and haven’t returned since.
Play around with the options provided by your platform, and see if you can find other useful ways to sort.
Signal 2
Next, take a look at your social channels, any review sites that contain a profile (whether you created it, or a customer made it on your behalf), and also read recent email communications from customers.
What are people saying about your business in these places? Are there pain points that could be solved with a simple site message? Are there suggestions or advice that might prove useful in developing your business? Can you post a coupon code on your social channels to win back some old faces?
Pay particular attention to negative comments. It might be worth making a list of them to pore over carefully before you make decisions.
Signal 3
Finally, bring to mind any recent experiences you had personally that you could learn from to further instill a sense of loyalty.
Decisions
The signals in this set are more qualitative than in the previous two examples. But that doesn’t mean your approach can’t be systematic.
Work with the data in Signal 1 (use filters and sort orders) to develop lists of:
- Your best customers.
- Customers with accounts (vs guests).
- Customers who only made one purchase.
- Anything else that seems interesting.
Customers who bought only once are incredibly valuable because they’re prime candidates for win-back emails (emails that remind them of your site and offer them an exclusive discount). Be careful here and ensure you comply with data privacy laws in your area. Reaching out is generally okay only if they have given prior consent.
From here, you may choose to target each customer type with a different promotion based on their general activity. You could even try personalized offers based on what they buy. Getting to know your customers will help you tailor activities to them. You might be surprised by what you find.
If you notice that everyone is checking out as a guest, it might be worth incentivizing account creation: “Earn points for every dollar spent”. Account signup processes generally make it really easy to include checkboxes so customers can consent to marketing emails. Allowing customers to check out as guests is still a must, though, because people want speed.
Combining the above with the analysis of your social channels might further demonstrate who your customers are. Social media can make it particularly easy to casually observe the ages and types of people who engage with your business. If you have a keen, responsive bunch of people on social channels, you might consider reaching out to them about joining your newsletter.
Newsletters work great alongside social accounts to create a community of regular buyers and help greatly with your goal of retention. Who can resist members-only deals? The only thing better than the discount is the exclusivity!
Now, let’s return to negative reviews or social comments you might have found. They may not seem like it, but each one is an opportunity to enhance your brand reputation. Reply carefully to any negative comments. Bear in mind that, on social channels and review sites, you’re writing the response as much for those who find it as for the original poster, so be nice!
If your social digging reveals an account you’ve let go to seed, or that there’s a backlog of comments you wish you’d noticed sooner, you might find a social media account manager useful. RelateSocial brings all your social channels into one dashboard and makes it much easier to monitor activity. You can even use AI to draft replies and posts.
Continuing in the same vein
Once you start thinking of things in this way, you’ll become more adventurous in the metrics you use, and more confident in the way you use them.
These ideas are intended as a starting point, and you’ll soon find yourself intuitively reaching for the right signals to fulfill your goal.
Quickfire examples
Let’s take a quickfire look at some of the other goals I mentioned, and examine how we might go about putting those through our framework.
Expanding content reach
To expand content reach, you might closely examine the metrics available from social platforms.
By analyzing the content you put out that achieved the best organic engagement metrics (likes, comments, subscriptions, etc.), you can promote the best-performing content or make more like it.
Building a local business
To establish a reputation for your local brick-and-mortar business, you might conduct a survey among your regular customers that asks if they would recommend you, and if not, what you need to change.
Conducting another survey of people who pass your store but don’t go in could help you understand their level of awareness of you, and what you could do to entice them inside.
From there, you might be able to tailor a campaign to encourage new customers among the most consistent demographic that comes to the surface, or expand to encompass more things that would make them consider using your business.
Taking the framework further
When in doubt, or if you find yourself getting lost in metrics at any point, return to the framework:
Goal → Signal → Decision
Go back to the goal, or failing that, create a new one, and try the journey again.
Once you get the hang of it, the ways you can use signals are endless. You can even take things further by setting up proper conversion metrics/key events on Google Analytics, which record and assign numerical value to actions people take (like purchases, making it to the checkout, etc.). This is particularly useful when combined with Google Ads.
If you ever need help with Google Analytics 4, try Ask Advisor, its built-in AI assistant, which can help you find and even analyze the metrics you need.
From here, you might even feel confident enough to branch out into more complex optimization metrics, but the most important thing to remember when you start out is to measure enough so you know what to do next.
Starting out with Analytics and Jetpack (or Matomo) is free, simple, and gives you more than enough to be getting on with. The rest will come.
Frequently Asked Questions
What’s the simplest way to start using analytics without getting overwhelmed?
Rather than diving straight into your data, start with a broad question about what you want your business to achieve. From there, follow a three-step framework: set a Goal (something you want to do better), find the signals (the evidence that shows how to move toward that goal), and make a decision (what you’ll do based on that evidence). If you ever get lost in the numbers, go back to your goal and start the journey again.
Why are people visiting my site but not buying anything?
High traffic can be misleading if you look at it in isolation. Compare your visitor numbers with your bounce rate and the average time spent on your site, then use a tool like Path Exploration in Google Analytics to see where visitors drop off. If you find they’re abandoning your flow at the checkout, test the process thoroughly across browsers, devices, and guest vs. account checkout. If it works fine technically, look at other factors, like limited payment options or high shipping costs, which can put buyers off at the last step.
A page gets lots of traffic but never makes sales. Is it worthless?
Not necessarily. Some pages act as an entry point that sends visitors on to products they do buy. Checking the journeys that start on that page will show whether it’s feeding sales elsewhere. If it is, you can optimize it to guide visitors more effectively, for example by adding links to related, higher-converting products.
How can I use data to encourage repeat customers?
Start with your orders data. Sorting customers by number of orders/money spent reveals your most loyal buyers, while reversing the sort shows one-time customers who could be won back with a targeted email and discount (provided they’ve given consent to be contacted). It’s also worth reviewing social channels, review sites, and customer emails for pain points and feedback, and considering incentives like loyalty points to encourage account creation, while still offering guest checkout.
Do I need expensive tools to track these metrics?
No. Most of the signals covered can be tracked for free using tools like Google Analytics, Google Search Console, and Jetpack, alongside the social media data and sales records you likely already have. As you grow more confident, you can set up conversion tracking in Google Analytics or use tools like RelateSEO and RelateSocial to turn your data into actionable tasks.